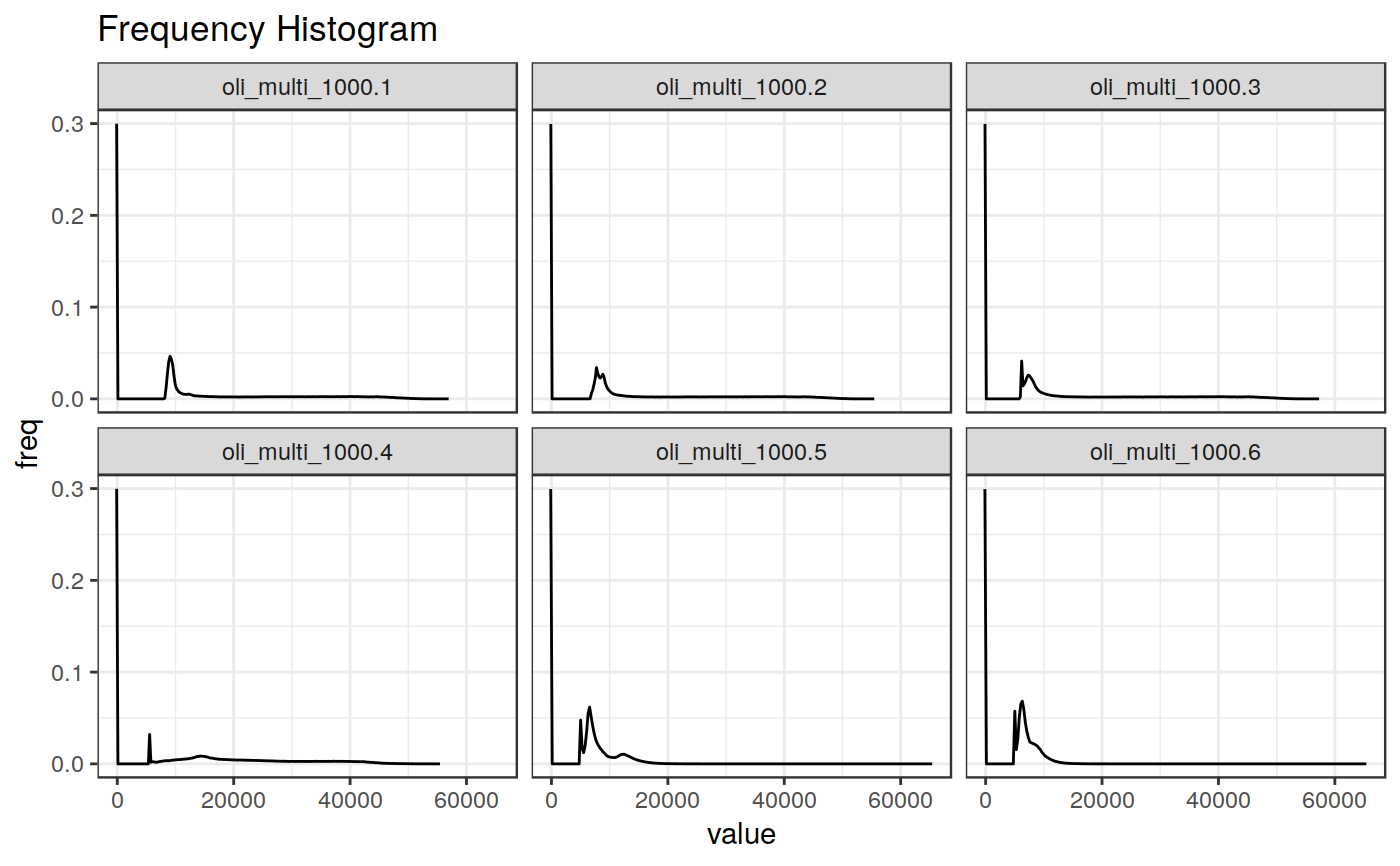
plot the frequency histogram of values of a raster, divided by band
plot_rasthist(in_rast, variable = "freq", type = "hist",
  verbose = TRUE)
Arguments
| in_rast | a |
|---|---|
| variable |
|
| type |
|
| verbose | If FALSE, suppress processing messages, Default: TRUE |
Value
A ggplot
Examples
in_rast <- read_rast(system.file("extdata/OLI_test", "oli_multi_1000.tif", package = "sprawl.data")) plot_rasthist(in_rast, type = "line")#>#>#>