Function used quickly retrieve statistics (min, max, mean, median sd, and eventually quantiles) for bands of a raster object
get_raststats(in_rast, quantiles = FALSE, hist = FALSE,
  verbose = TRUE)
Arguments
| in_rast | a |
|---|---|
| quantiles |
|
| hist |
|
| verbose | if FALSE suppress messages, Default: TRUE |
Value
a list containing the following elements:
stats:
data.framecontaining min, max, average and standard deviation for each band (see examples);quants:
data.framecontaining the quantiles of the distribution of raster values, for each band (100 value - 0.01 interval) (NULL is returned ifquants== FALSE (the default));hists:
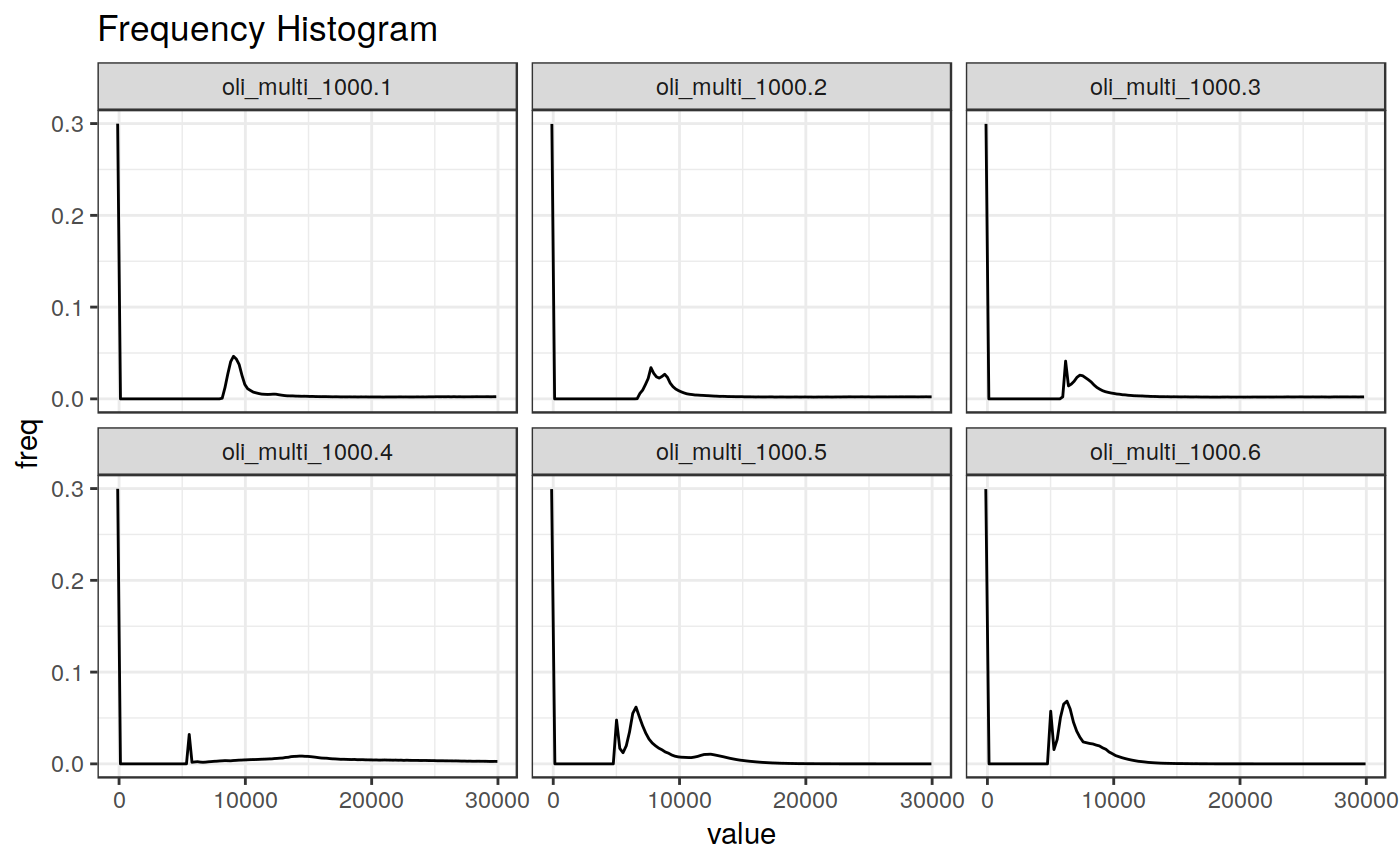
data.framecontaining information about the distribution of raster values for each band. the data frame includes the limits of each bin, the count of the number of pixels included in it, the corresponding frequency and the cumulated frequency at each bin (NULL is returned ifhists== FALSE (the default));
Examples
library(ggplot2) in_rast <- system.file("extdata/OLI_test", "oli_multi_1000.tif", package = "sprawl.data") get_raststats(in_rast)#>#> $stats #> min max avg sd band #> 1: 0 57048 14646.024 14498.970 1 #> 2: 0 55558 13907.527 14207.094 2 #> 3: 0 57400 13891.930 14769.282 3 #> 4: 0 55552 15428.359 13687.184 4 #> 5: 0 65535 5995.777 4660.999 5 #> 6: 0 65535 5180.533 3722.452 6 #>get_raststats(in_rast, quantiles = TRUE)#>#> $stats #> min max avg sd band #> 1: 0 57048 14646.024 14498.970 1 #> 2: 0 55558 13907.527 14207.094 2 #> 3: 0 57400 13891.930 14769.282 3 #> 4: 0 55552 15428.359 13687.184 4 #> 5: 0 65535 5995.777 4660.999 5 #> 6: 0 65535 5180.533 3722.452 6 #> #> $quants #> quant val band #> 1: 0.00 -111.859 1 #> 2: 0.01 -111.859 1 #> 3: 0.02 -111.859 1 #> 4: 0.03 -111.859 1 #> 5: 0.04 -111.859 1 #> --- #> 602: 0.96 10665.500 6 #> 603: 0.97 10922.500 6 #> 604: 0.98 11693.500 6 #> 605: 0.99 12721.500 6 #> 606: 1.00 65406.500 6 #>get_raststats(in_rast, hist = TRUE, quantiles = TRUE)#>#> $stats #> min max avg sd band #> 1: 0 57048 14646.024 14498.970 1 #> 2: 0 55558 13907.527 14207.094 2 #> 3: 0 57400 13891.930 14769.282 3 #> 4: 0 55552 15428.359 13687.184 4 #> 5: 0 65535 5995.777 4660.999 5 #> 6: 0 65535 5180.533 3722.452 6 #> #> $quants #> quant val band #> 1: 0.00 -111.859 1 #> 2: 0.01 -111.859 1 #> 3: 0.02 -111.859 1 #> 4: 0.03 -111.859 1 #> 5: 0.04 -111.859 1 #> --- #> 602: 0.96 10665.500 6 #> 603: 0.97 10922.500 6 #> 604: 0.98 11693.500 6 #> 605: 0.99 12721.500 6 #> 606: 1.00 65406.500 6 #> #> $hists #> value count freq cumfreq band #> 1: -111.8590 291848 2.999034e-01 0.2999034 1 #> 2: 111.8588 0 0.000000e+00 0.2999034 1 #> 3: 335.5766 0 0.000000e+00 0.2999034 1 #> 4: 559.2944 0 0.000000e+00 0.2999034 1 #> 5: 783.0122 0 0.000000e+00 0.2999034 1 #> --- #> 1532: 64378.5000 0 0.000000e+00 0.9999990 6 #> 1533: 64635.5000 0 0.000000e+00 0.9999990 6 #> 1534: 64892.5000 0 0.000000e+00 0.9999990 6 #> 1535: 65149.5000 0 0.000000e+00 0.9999990 6 #> 1536: 65406.5000 1 1.027601e-06 1.0000000 6 #>#>#>#>#> Warning: Removed 138 rows containing missing values (geom_path).